

A bug in production
Kelsey is a QA working for a company that builds an OTT Entertainment app. This app allows users to watch videos online, download and play videos later, etc.
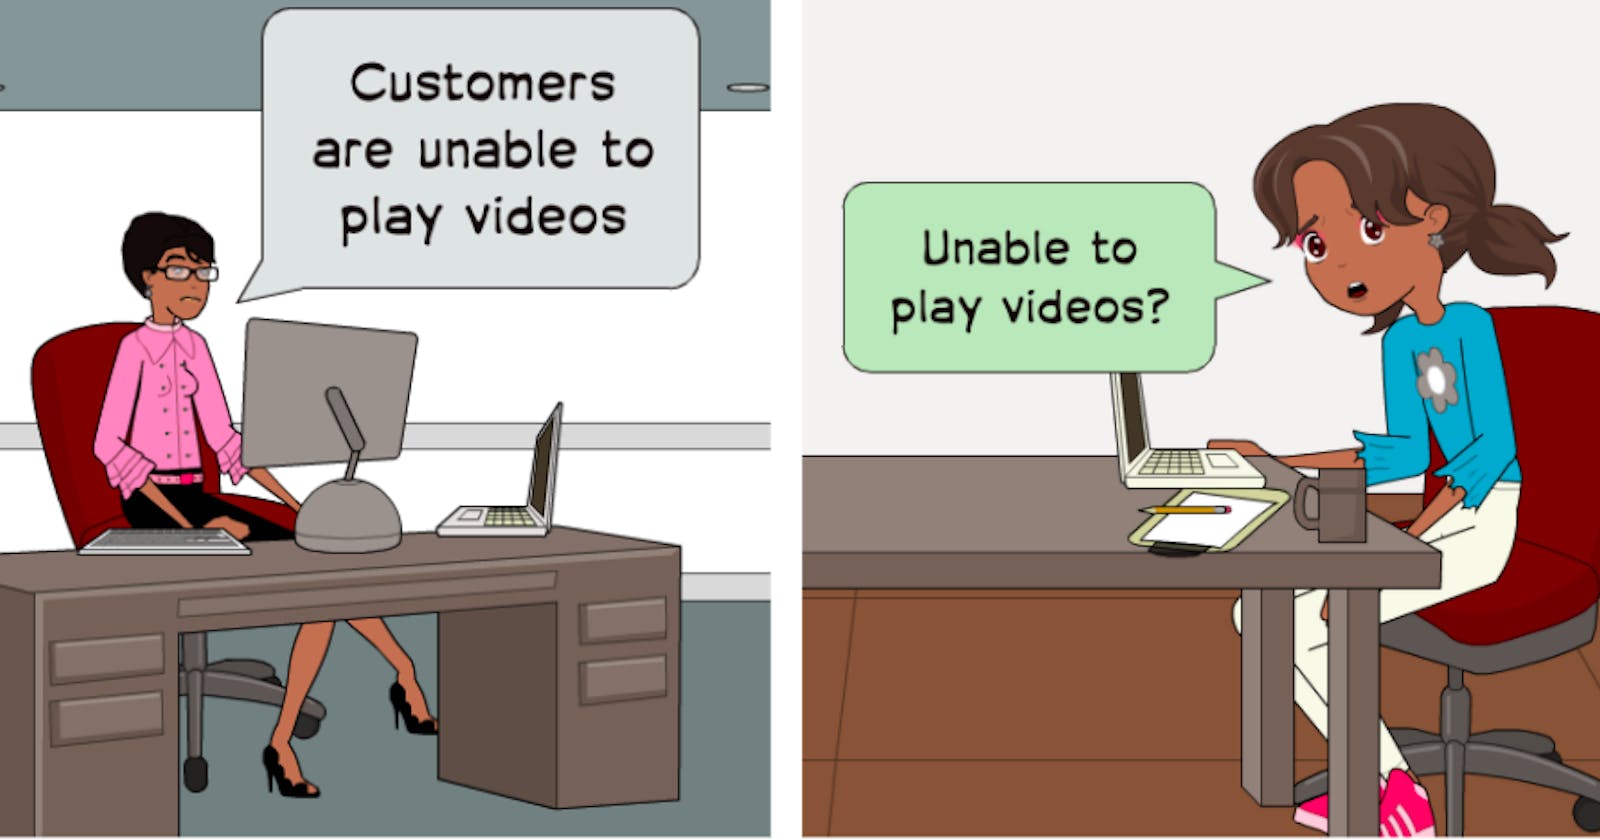
One day, Kelsey gets a call from Sandra - the Regional Head.
"This must be something important", thinks Kelsey as she answers the call.
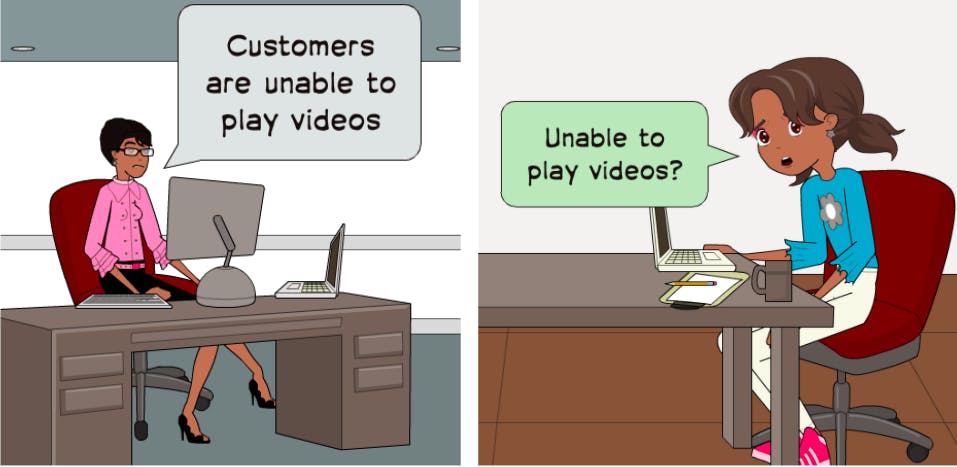
Sandra says, "It looks like customers are not able to play videos".
"Not able to play videos?", asks Kelsey, shocked. "That is probably the most critical feature of the app", she thinks to herself.
"Yes it looks like that", replies Sandra.
Kelsey then asks Sandra some questions to understand the issue better.
Kelsey: What errors are users seeing?
Sandra: Jake, our customer support head, might know the details
Kelsey: When did the issue start?
Sandra: Looks like it started after the latest app release
Kelsey: Is the issue happening in some specific countries or on some devices only? Is there some pattern?
Sandra: No, it seems to be a problem for all users on this latest version of the app
Kelsey says that she will investigate this further and hangs up the call.
Initial Investigation
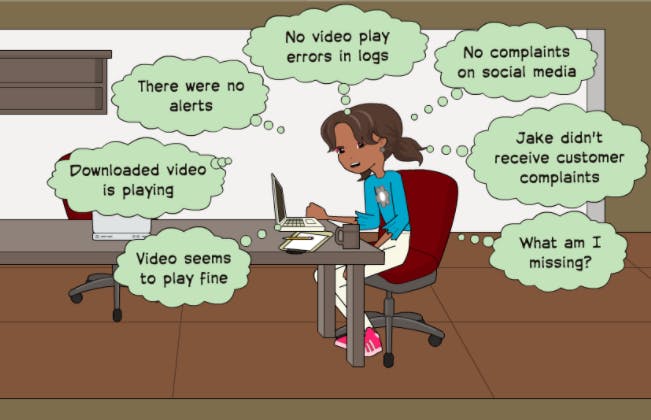
Kelsey then performs a bunch of checks from her end:
- She first opens the app and tries to play a video. It plays fine
- She wonders if it's an issue with downloaded video. She checks that and it plays fine as well
- She wonders if it was an issue only at a certain time. She checks if she missed some alerts. But there weren't alerts either
- She checks logs but can't find any errors related to video play
- She checks the company social media handles too. There don't seem to be any complaints there either
- She decides to speak to Jake - their Customer Support Head. Jake says the support team hasn't received any complaints related to video play issues
"What am I missing?", wonders Kelsey.
Kelsey decides to speak to Sandra again.
Dashboard details
Kelsey asks Sandra, "How did you discover that users might be unable to play videos on the latest version of the app? Where did you see this information?"
"I looked at the dashboards, of course", replies Sandra. "DAU is normal but DAV is almost zero".
Kelsey doesn't understand what these terms mean. She also has no idea what dashboard Sandra was referring to. She asks Sandra to help her understand.
Sandra says, " We track some important actions that our users perform on the app. We call them analytics events. They are basically API calls to our 'analytics' server with some details that are required for us to take decisions".
"DAU is an acronym for Daily Active Users". She then explains what it means in the context of their app.
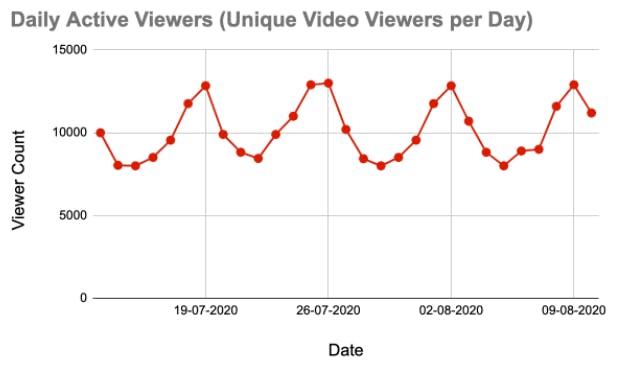
"When user opens the app, we make an API request to our analytics server with some information about the user like their userId. So, if a user launches the app on a given day, then that is user is active user on that day. If you aggregate all active users per day over a period of time, you get a graph like this", she says and shows Kelsey a graph that looks a little like a wave.
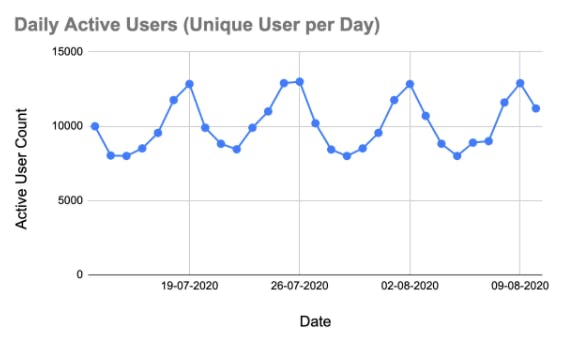
"This graph shows us a trend that there are least number of active users on Wednesdays and most over the weekends", Sandra says. Kelsey nods.
Sandra continues, "In our app context, we use the term DAV to mean Daily Active Viewers".
"When a user watches a video, we make another API request i.e. we send another analytics event. This is called the video_start event. It has details about which video the user played, etc."
"So, if a user watches at least one video in a given day, then that user is an active viewer for that day"
She then proceeds to show a typical graph of Daily Active Viewers. It looks very similar to the Daily Active Users graph.
Sandra explains, "The two graphs look similar because most users who launch the app play at least one video during the day".
Kelsey now understands the terms. She then asks Sandra to explain the issue.
Sandra shows Kelsey the graph.
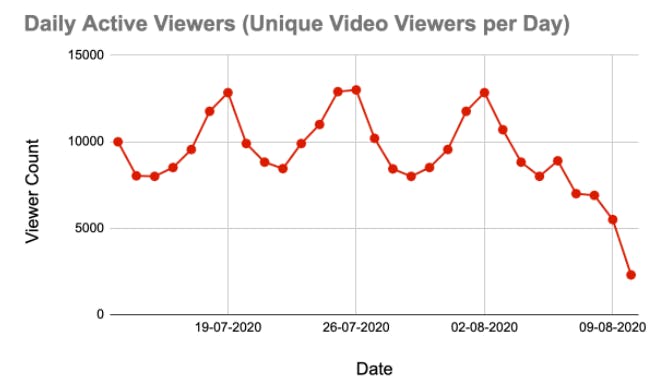
She says, "The number of Daily Active Viewers seems to be going down after Thursday. We released the new version of the app on Thursday. So I suspect it could be something to do with it".
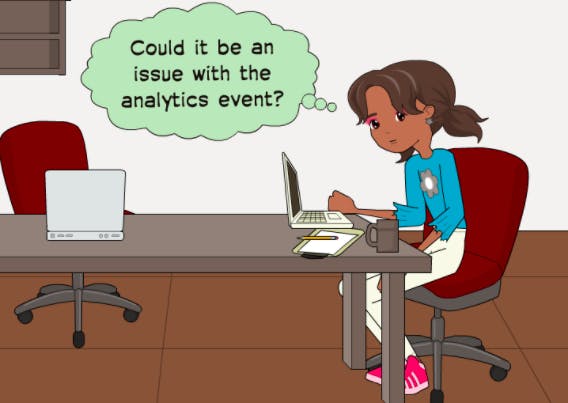
Kelsey now wonders if it could be an issue with the analytics event and not an issue with actual video play.
Issue in Analytics Event
Kelsey then checks the network logs. She observes that when she starts playing a video, there is no API call to their analytics server with information about which video is being played i.e. video_start event is not being sent.
Kelsey then installs the older app version and she observes that in the older version, a video_start analytics event was being triggered every time she started playing a video.
Heaving a sigh of relief, Kelsey thinks, "The issue is only with the analytics event. The end users can still play videos without an issue!"
Before we get into the details of why this issue occurred, let's first see whether analytics data is valuable.
Is Analytics Data Valuable?
Let's think about an answer to this question by considering different stakeholders.
Business Decision Makers
Example 1: Budget for new movie
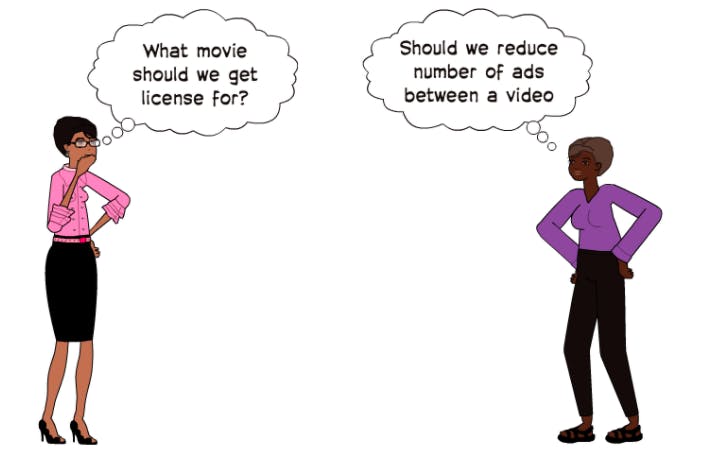
Let's say that there is some budget to get license for a new movie that can be played on the app. What kind of movie should they get the license for? Should it be comedy or should be it action?
If we have data about what kind of content most users of our app typically like, an informed decision can be made
Example 2: User Experience
Let's say that with data we notice a trend that if there are 3 ads played between a long format video, users get frustrated and stop watching the video. But if there are just 2 ads, they usually tend to watch the video till the end. Having this kind of information can probably help teams make a decision about number of ads that can be shown to users without impacting their overall experience.
UX & Product Specialists
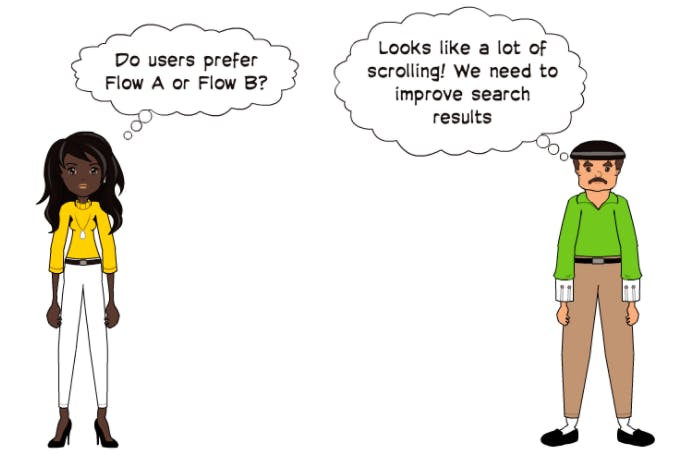
Example 1: A/B Testing
Let's say that the team wants to compare two versions of the feature that they're building to see which one performs better i.e. they want to A/B test the feature. To understand which version performs better, they will need analytics information.
Example 2: Measuring what is Built
Let's say that we recently released a feature to search for movies. We could capture the position of the search result that the users select after searching.
If we observe that users scroll a lot before selecting a search result, it could be an indication that the search functionality needs improvement.
Analytics data can help us measure what we build.
Developers and QAs
Example 1: App Crash
Let's say that users can view details like cast, ratings, etc. of a video they select. On this details page, we also display a "Similar" section which lists similar videos.
One day we find that if we try to play videos from this Similar section, the app crashes.
App crash seems like a high severity bug. We decide to look at analytics data.
Let's say that this is the graph that shows where users start play videos from.
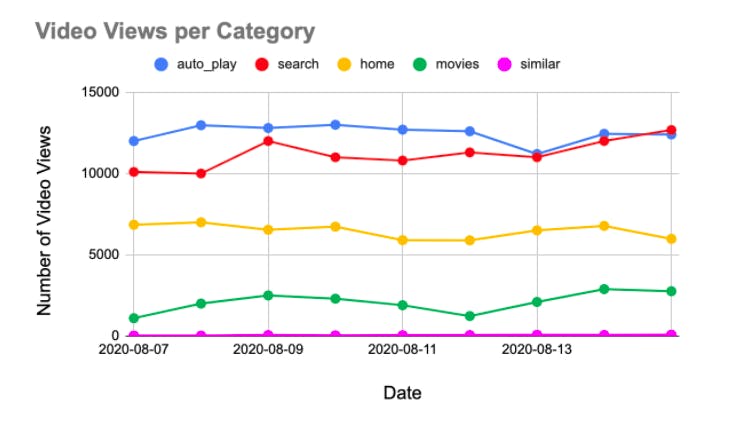
We can see a lot of users search for videos and play them.
We can see that many users watch videos because of the auto-play functionality. We can also see that users playing videos by selecting them directly from the Home page or from the Movies category page is large too.
But what about playing videos from the "similar" section?
The number of users playing videos from the similar section is very low. It's not zero, but pretty close to that.
Considering this data, we can probably conclude that this app crash is not as severe as we had initially thought.
So data, can help us understand severity of bugs better.
Example 2: Most used Devices, Browsers, OS
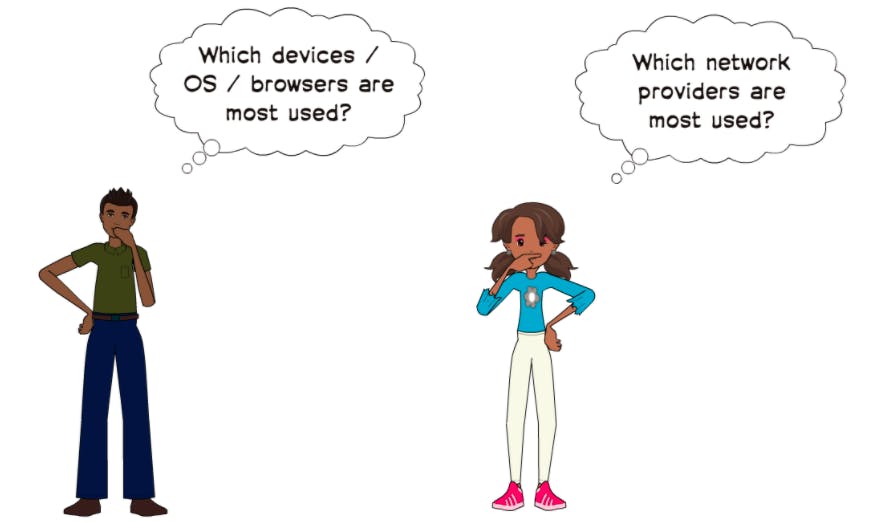 Analytics data can give us information about what are the devices, browsers or OS our users are using the most. This data can help us understand on which areas we should focus our testing.
Back to our Story...
Now, let's go back to our story and look at why the analytics issue happened.
Why did the issue happen?
During some code refactoring, a team member unintentionally deleted the code related to sending analytics data when videos are played
Why was the issue not found earlier?
On the team, unfortunately, there were no tests for verifying analytics events.
Also, the general attitude that the team had was to focus on the functionality provided to the end users. As end users were not concerned with analytics data and it didn't affect them directly, the team did not focus on it
Also, most members on the team were not aware of how analytics data could impact business and decisions.
Some Important Realisations
After this incident, Kelsey and the team realised that it was important for them to treat other stakeholders as users too.
They understood that many business decisions are based on analytics data. These decisions concern the customers. So, accurate data is important to delight the customers.
They started paying more attention to analytics events and stated testing them actively after this realisation.
Acknowledgements:
- Thanks Sreekrishnaa for reviewing the post
- All comic strips made using Pixton.com