Part 10: Debugging e2e tests from VSCode
Sometimes, it could be useful to attach a debugger and check details during the test run. This post explains how to debug an e2e test scenario using VSCode.
Steps
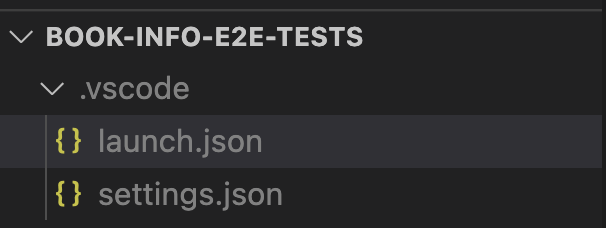
Create .vscode/launch.json file at the root level of the project:
Add arguments in the launch.json file to get inputs about app_path and features that we want to run. You can also set default values for these arguments. An example of how this could look is below:
{
  "version": "0.2.0",
  "configurations": [
    {
      "name": "Web Test",
      "type": "node",
      "request": "launch",
      "args": ["config/wdio-web-chrome.conf.ts", "--platform=web", "--features=${input:features}"],
      "cwd": "${workspaceFolder}",
      "autoAttachChildProcesses": true,
      "program": "${workspaceRoot}/node_modules/@wdio/cli/bin/wdio.js",
      "console": "integratedTerminal"
    },
    {
      "name": "Android Test",
      "type": "node",
      "request": "launch",
      "args": ["config/wdio-app-android.conf.ts", "--platform=android", "--app_path=${input:app_path}", "--features=${input:features}"],
      "cwd": "${workspaceFolder}",
      "autoAttachChildProcesses": true,
      "program": "${workspaceRoot}/node_modules/@wdio/cli/bin/wdio.js",
      "console": "integratedTerminal"
    }
  ],
  "inputs": [
    {
      "type": "promptString",
      "id": "app_path",
      "description": "App Path",
      "default": "<absolute_path_to_app>"
    },
    {
      "type": "promptString",
      "id": "features",
      "description": "features",
      "default": "book-details.feature"
    }
  ]
}
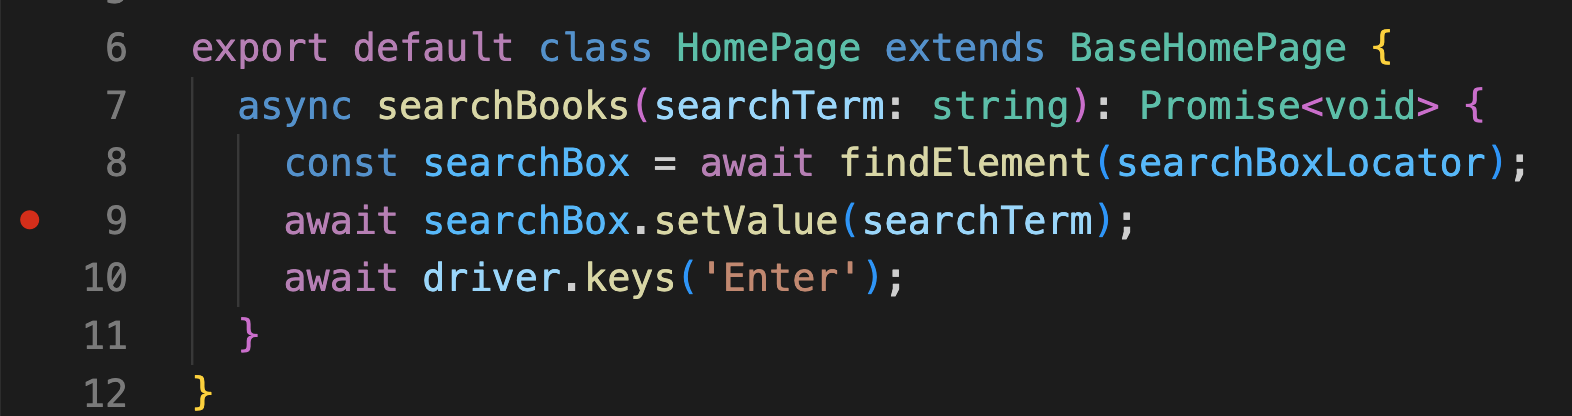
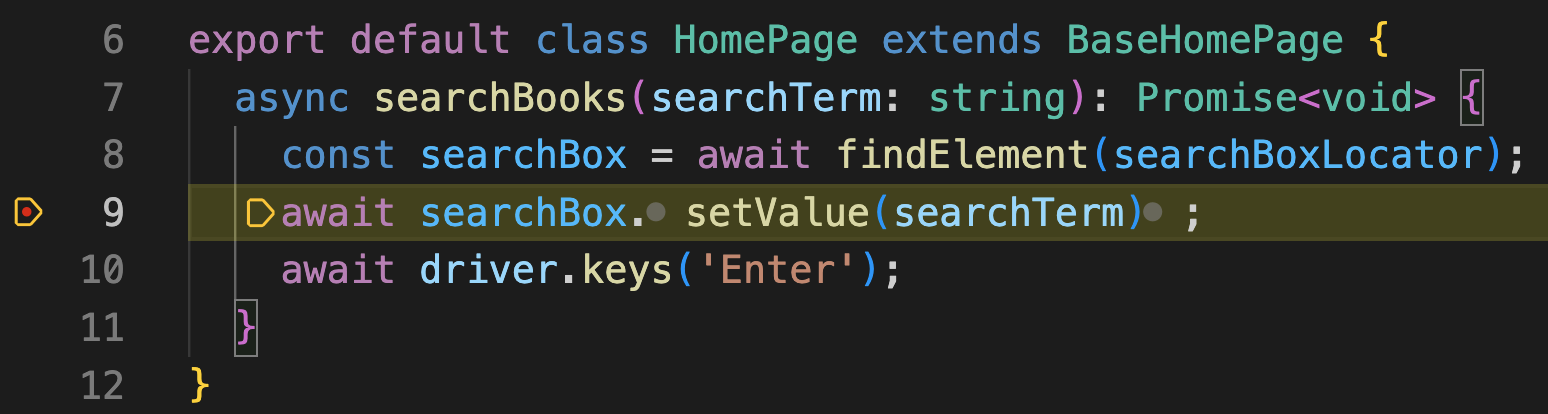
Add breakpoints to your code where required.
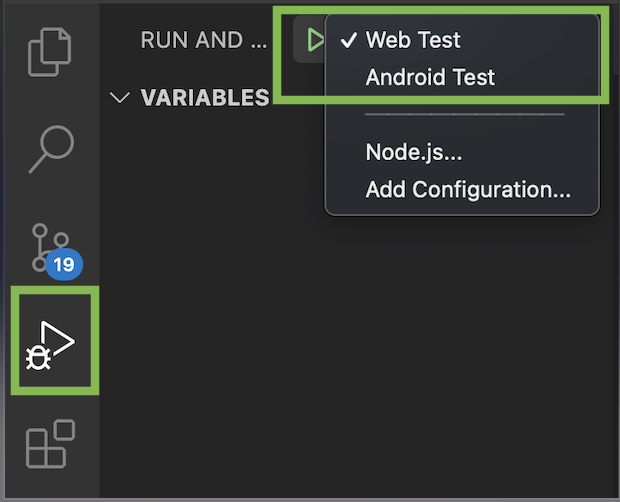
Select Run and Debug from the Activity Bar and then select the test run platform from the dropdown as shown below.
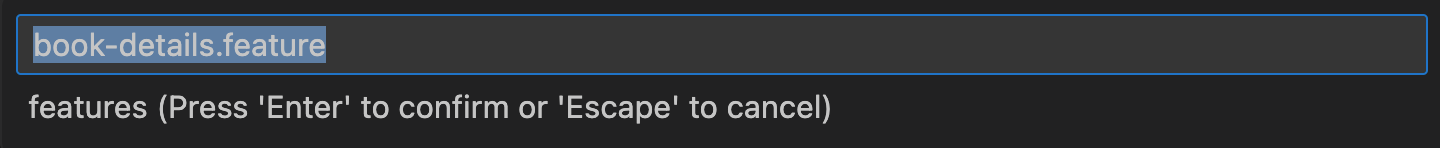
Press the Play button and enter the required details in the prompts and press Enter.
Start debugging!
The execution will pause at the breakpoints you have.
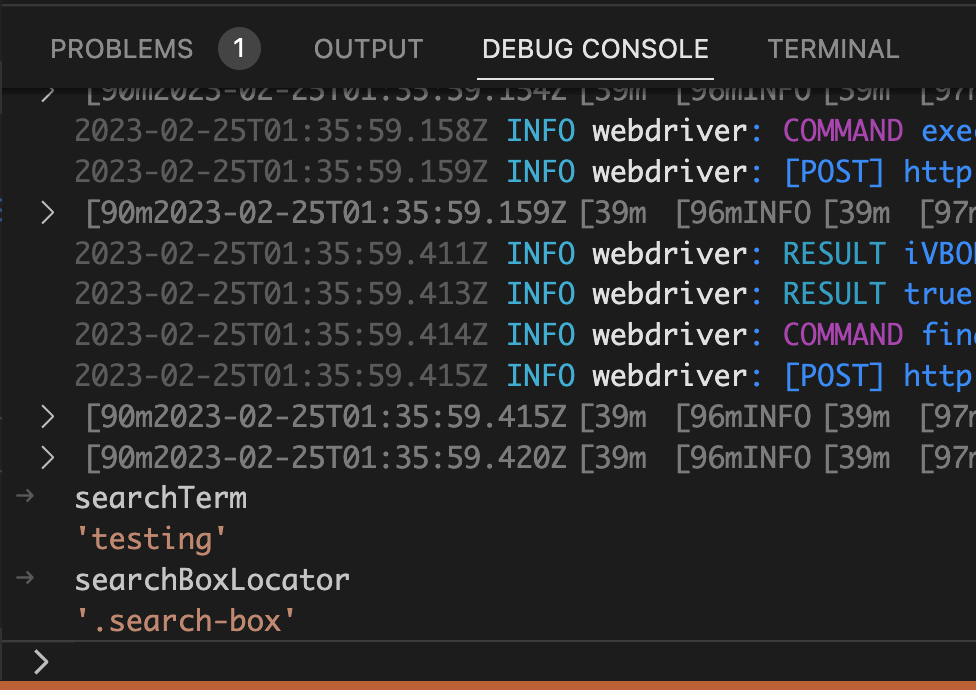
You can enter variable names, expressions, etc. in the debug console on VSCode to see the values.